Wallboards
Welcome to uContact Wallboards!
With this guide, you'll learn step by step what they are, what they're for, and how to leverage them to make informed decisions that positively impact your business.
First, what is a Wallboard?
A Wallboard is a real-time dashboard that allows you to visualize everything happening in your business in a visual and easy-to-understand way, through different panels that display data in a personalized manner. This way, you can monitor what's happening in your operation, detect improvement opportunities, and act quickly.
What is a panel?
A panel is each chart or block of information within your Wallboard. Each panel displays a set of data in a clear and attractive way. You can combine multiple panels to compare information and track important indicators.
What are the types of panels?
There are 6 types of panels, each designed to display information in the most useful way according to your needs:
- Bar chart: Compares different values using vertical bars. Useful for viewing totals by category (for example, number of incoming, outgoing, and abandoned interactions).
- Line chart: Shows how data evolves over time. Ideal for viewing trends (for example, incoming interactions per day).
- Donut chart: Shows proportions using a ring with a hole in the center. Perfect for viewing percentages and simple comparisons (for example, connection time vs. break time).
- Pie chart: Similar to the donut, but without a hole in the center. Also shows proportions or percentages.
- Table: Displays detailed data in rows and columns. Ideal for viewing lists or large volumes of information (for example, a list of campaign agents along with the number of interactions they started, those they completed, and their login time).
- Total: Displays a single key value (for example, total calls received). Useful for highlighting important figures.
 Bar chart
Bar chartAllows you to compare different sets of data using vertical bars. It's useful for showing comparisons of quantities or data that aren't necessarily time-related. For example, it can be used to show the number of dispositions by name.
 Line chart
Line chartAllows you to visualize data over time in a visual and clear way. It's useful for comparing trends and seeing how data evolves. For example, it can be used to show the evolution of incoming interactions in a campaign.
 Donut chart
Donut chartAllows you to show the proportion of different sets of data using a donut chart. It's useful for showing percentages and proportions. For example, it can be used to show the relationship between connection time and break time.
 Pie chart
Pie chartAllows you to show the proportion of different sets of data using a donut chart. It's useful for showing percentages and proportions. For example, it can be used to show the relationship between connection time and break time. The difference between this type of chart and the donut chart is that the donut chart has a hole in the center.
 Table chart
Table chartAllows you to display data in table format. It's useful for showing a large amount of data in a single view. For example, it can be used to display detailed information about campaigns.
 Total
Total
TotalAllows you to display a total value of a set of data for the time interval we establish in the global filters. It's useful for showing a total value of a set of data. For example, it can be used to show the total number of interactions received in a campaign.
What is a source?
Each panel needs to know where to get the data from and what data we want, that's what we call source and metric. For example, if you want to see how many messages are coming in per campaign, you choose the 'Campaigns' source and the 'Incoming messages' metric.
Each panel needs to know where to get the data from. That's what we call a source.
The available sources are:
- Campaigns: Data about campaigns: service level, incoming messages, outgoing messages, etc.
- Agents: Agent performance data: connection time, calls answered, adherence time, among others.
- Outbound Hub: Automatic dialer metrics: outgoing calls, failed calls, etc.
- Custom queries: If you need something more specific, you can create an SQL query to bring the exact data you want. (Requires basic SQL knowledge and specific permissions).
Within this source, we'll find everything related to different campaigns. For example: service level, incoming messages, outgoing messages, and others.
 Agents
AgentsWithin this source, we'll find everything related to agents. For example: connection time, adherence time, number of calls answered, and more.
 Outbound Hub
Outbound HubWithin this source, we'll find everything related to automatic dialers. For example: outgoing calls, failed calls, etc.
 Custom queries
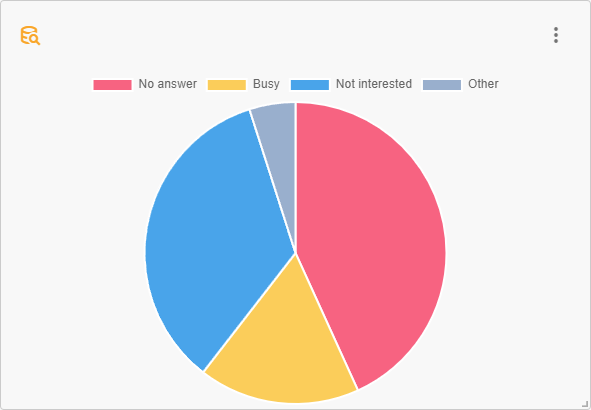
Custom queriesThis source doesn't have predefined metrics. We'll have to create a query to obtain and model the data to our liking. When using a query to obtain data, we must write an SQL statement that will obtain the information directly from the database. For this, it's necessary to have knowledge of how these queries are constructed, as well as the permissions mentioned earlier. Below is an example of a query, the type of chart it was modeled on, and what we were seeking to obtain.
SELECT
  COUNT(CASE WHEN value1 = 'No answer' THEN 1 END) AS 'No answer',
  COUNT(CASE WHEN value1 = 'Busy' THEN 1 END) AS 'Busy',
  COUNT(CASE WHEN value1 = 'Not interested' THEN 1 END) AS 'Not interested',
  COUNT(CASE WHEN value1 NOT IN ('No answer', 'Busy', 'Not interested') THEN 1 END)
   AS 'Other'
FROM ccrepo.dispositions_repo;
This query aims to obtain data on dispositions grouped by their name, so we can compare the different level one dispositions. This query is very useful for visualizing it within a pie chart and thus comparing the totals with each other.
If you want to learn more about how to create queries, refer to the Queries section.
Recap: A summary of what you need to know
- A Wallboard is your board for monitoring your business performance.
- Panels are the charts that display information
- There are 6 types of panels: bar, line, pie, donut, table, and total.
- Each panel is fed by a source: Campaigns, Agents, Outbound Hub, or a custom query.
🚀 Time to create your Wallboard!
Now that you know the key concepts about Wallboards, you can create one to analyze your business data. Use the following guide to create your first Wallboard!